A session transcript is authoritative about what was attempted. Git is authoritative about what shipped. For three months ENGRAM had only the first one, and I did not notice I was asking it the wrong questions.
Back in May I wrote about ingesting Claude Code sessions into ENGRAM, and I claimed the integration closed the gap between what I researched and planned and what I actually built. That post is still right about the mechanism. It was too generous about the claim.
Here is the thing I could not see at the time. A session transcript is a record of attempts – the diagnosis that went nowhere, the approach that was abandoned at 11pm, the refactor that was half-finished when the context window filled. All of that is genuinely valuable, and none of it tells you whether the feature got built. I had a beautiful, entity-linked, retrievable archive of everything I had tried, and I was querying it as though it were a record of outcomes.
This post is about the correction: the Build Timeline, which is now live on PROD, and the session-capture layer that arrived with it. It is also, in a smaller way, a post about the series revising one of its own beliefs — which is a thing I built ENGRAM to do, so it seems only fair to do it in public.
What the sessions couldn’t tell me
The gap, concretely.
Session ingestion gives you an excellent answer to “what was I doing on the 17th.” Pick a date, get the summary, the recaps, the file edits, the entities, ranked into the same graph as everything else. I use it constantly.
It gives you no answer at all to two questions I kept asking anyway:
- What has been built, and when? Not what happened in one stretch of work, but the shape of the system as it stands, and how it got that way. Sessions are episodes. Episodes do not accumulate into a shape on their own.
- What is connected, and what is not? Which pieces depend on which; what shipped; what got started and quietly abandoned; what exists in the repository and has never been deployed.
Behind that sat a second, more structural problem. Everything ENGRAM knew about my coding work was derived from one harness’s private storage format — the JSONL transcript files Claude Code writes under ~/.claude/projects/, read by a byte-offset cursor. That coupling produced exactly the limitations you would predict. Sessions run from Claude Desktop, which uses a database rather than files on disk, were simply invisible. Transcripts that had been auto-pruned were unreachable, and their meaning went with them. And reconstructing what a session meant after the fact was expensive — minutes of wall time and a substantial model bill to infer, from a transcript, things that were already recorded as facts somewhere else.
Both problems have the same root. ENGRAM was inferring outcomes from a record of attempts.
Two authorities
The design thesis, concretely.
Git and GitHub are authoritative about outcomes. A commit, a tag, a release, a CI conclusion are ground truth for what was built and when. They are already structured, already durable, already harness-independent, and free to extract. No model is required to read them and no model should be allowed to interpret them.
A session recap is the only record of why. The approach that was rejected. The reasoning behind a schema choice. The bug found mid-flight and the thing it revealed. None of that survives in a commit message.
So the Build Timeline is git-sourced for its spine and session-annotated for its narrative, and the two are joined on file paths — the files a session touched, mapped to the components those paths belong to.
That split is not new to this feature. It is the same boundary I described in the fact-update work: deterministic where the signal is unambiguous, inference only for the residue. When an article supersedes another, the memory imprinted from it supersedes too, and no model needs an opinion. When two beliefs might contradict, that is a judgement and the judge earns its keep. Here the ratio turned out to be even more lopsided than I expected.
Four layers, and the surprise in the middle
The architecture, concretely.
Four layers, with a deliberate line through the middle of them.
Extraction runs as shell scripts and emits normalised JSON. Commit history with per-file line counts, tags dereferenced to their target commits, merge topology, the conventional-commit scope parsed off each subject, CI run conclusions, and the present-tense file inventory. Nothing here is a judgement call. It costs seconds and zero tokens, and it produces the same output every time.
Decomposition turns that JSON into components. This is the layer I got wrong in the original design, and the way I got it wrong is the most interesting finding in the whole project.
I assumed clustering a repository into components was model-shaped work, with the directory tree as a prior to help it along. So I scored two passes blind against a hand-authored inventory. A naive fixed-depth directory cut recovered 65% of the components — not good enough, and it failed in a specific way, systematically merging things that belonged apart. Then I scored a variable-depth, kind-aware structural rule set. It recovered 100%, at around 85% precision, with no model invoked at all. Two components the blind hand-list had missed were surfaced by the clusterer rather than by me.
The reason that matters is not elegance. It is that determinism is what makes the write safe. A model-driven clusterer would have named things slightly differently on every run, which means every run would have produced spurious “new” components, which means I would have needed a fuzzy reconciliation layer to match them up — and that layer is its own permanent source of quiet history corruption. Deterministic rules do not solve that problem; they remove it. I have written it into the design as a property to be defended, because the 100% number is memorable and the reason behind it is not.
The graph write takes the assembled snapshot and derives nodes in the house style, which I will come back to. The view is two renderings from one source: a native lifecycle panel in the app, and a Mermaid dependency graph as plain text for the terminal and GitHub. The Mermaid deliberately never becomes an ENGRAM article. Entity extraction runs over raw passage text with no code-fence stripping, so a Mermaid block would pollute the entity graph with syntax tokens. Small finding, cheap to discover early, expensive to discover late.
A lifecycle nobody typed
What the panel actually shows, concretely.
Every component moves through four states, and each one is a signal read from git rather than a label anyone applied:
- scaffolded – the first commit that touched its files. It came into existence.
- wired – the first dependency it declares. It got connected to the rest of the system.
- tested – the first commit touching a test path that maps to it.
- deployed – the first release that shipped one of its commits.
That last one hides the trap in miniature. The obvious rule is “a version tag containing this commit means deployed.” The correct rule is “a version tag containing this commit whose deploy job concluded successfully.” A tag that fired a deploy which then failed is not a deployment, and treating it as one would put a component into deployed on the strength of an attempt. The whole feature exists to stop confusing attempts with outcomes, and the confusion was sitting inside the fix for it.
Not everything has a build state, either. A documentation corpus or a folder of operational scripts genuinely does not have “deployed” – it has creation and modification activity and nothing more. Rather than fork the schema with a second node label, which would fork every query and every renderer for a distinction one property wide, components carry a discriminator and the state machinery simply is not written for the ones that do not have one.
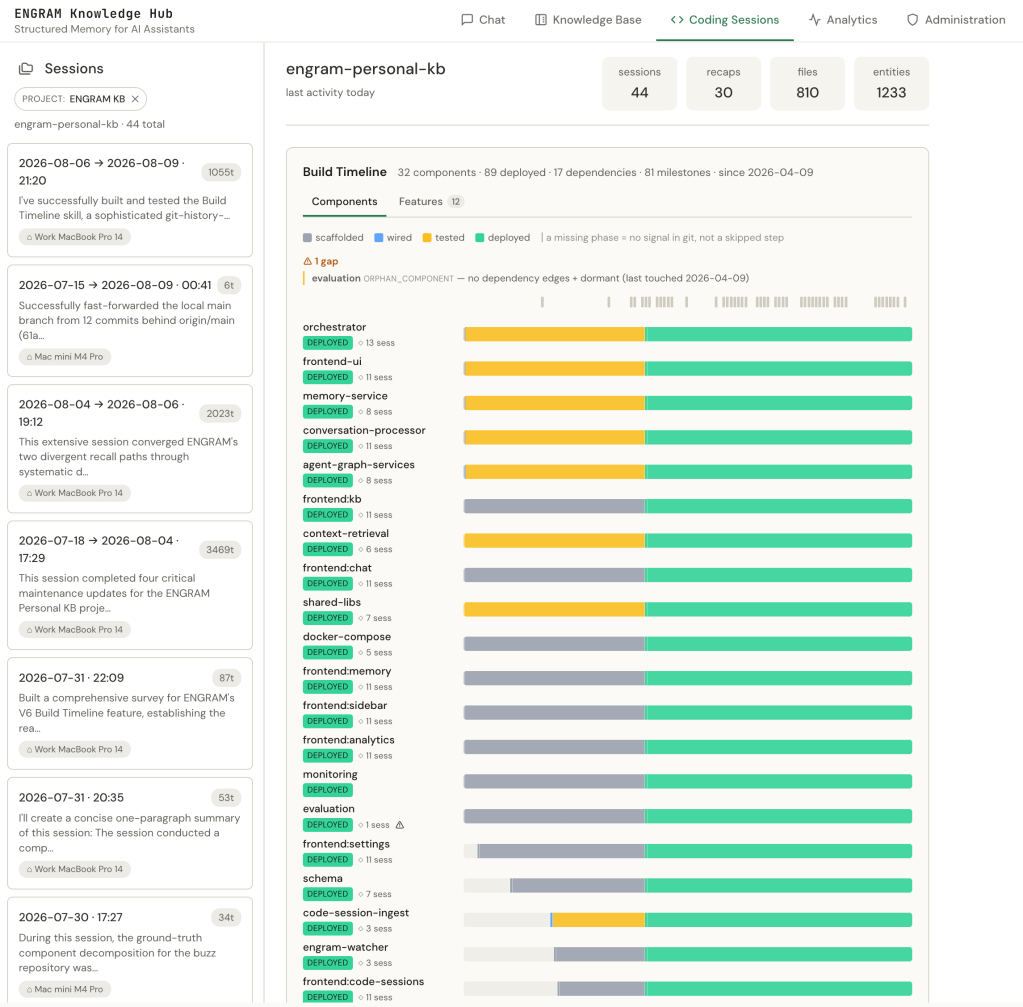
Everything on this screen was derived from the repository’s own history — no annotations, no configuration, nothing added to the repo.
Three details on that screen are worth pausing on. The legend says, in so many words, that a missing phase means no signal in git, not a skipped step. shared-libs component has no wired band because nothing it declares points outward – everything depends on it. That is correct and it would read as a failure without the legend.
The session counts beside each component are not decoration either. Click one and the row unfolds into the captured sessions that touched that component, each one dated and each one a link straight into the work: open it and you get the summary, the recaps, the file edits. That is the git spine handing back the narrative — the bar tells you when agent-graph-services reached deployed, and the eight sessions underneath it tell you what we were arguing about while it happened.
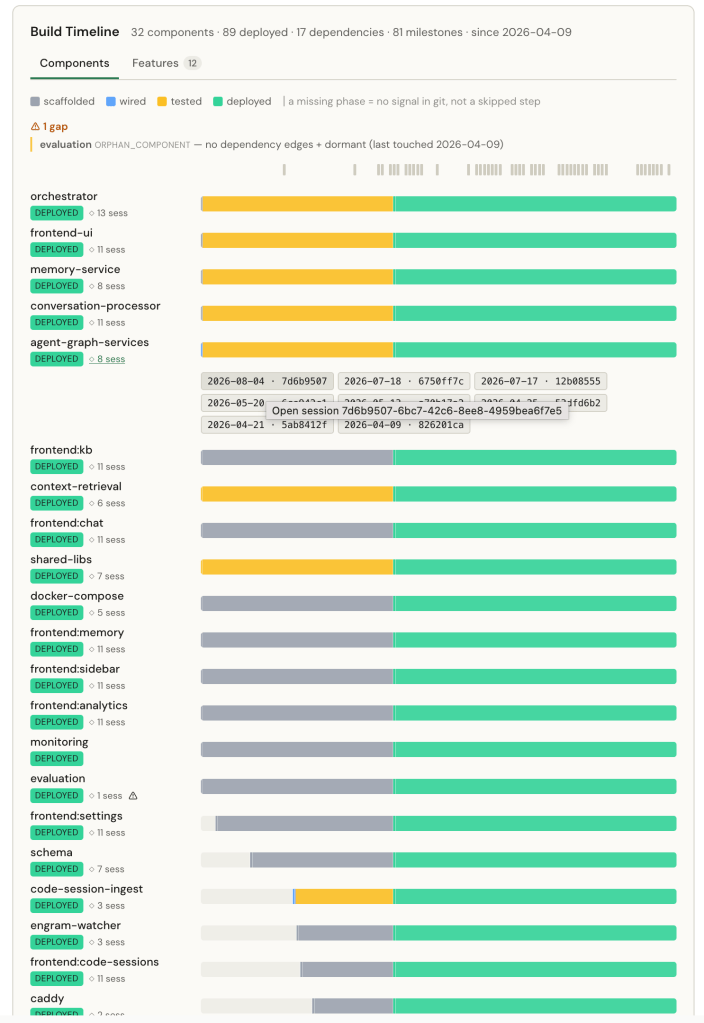
Two clicks from “this component shipped in June” to the transcript of the afternoon it shipped in.
And the amber gap flag is the timeline noticing something on my behalf. Until recently there were two: engram-watcher and evaluation, both flagged as orphans – no dependency edges, no activity for months. The watcher flag has since cleared itself, without my doing anything about it directly, because the capture work described further down this post brought that component back to life. That is the behaviour I wanted: the flags are an observation about the repository’s present state, not a to-do list that has to be ticked off. The one that remains is evaluation, a leftover from before the repository was forked. It has been dormant since April and I had stopped seeing it entirely.
The same shape as everything else
The house style, concretely.
The part of this I am most pleased with is the part that required the least invention.
Component states carry valid_from and valid_until bounds. A new observed state appends a node and stamps an end on the previous one. Nothing is mutated and nothing is deleted. That is precisely the model the fact-update work introduced for memories, which means what did this system look like on 1 June is the same query shape as what did I believe about this on that date. And it fell out for free, because the pattern was already there to reuse.
It also means re-running is boring, which is the goal. Components match on identity, states supersede rather than overwrite, and because the decomposition is deterministic the same repository re-derives the same snapshot. Run it twice with nothing changed in between and the second run writes nothing at all. Run it after a week of work and it appends exactly what is new (a component that did not exist before, a dependency newly declared, a state freshly reached) and leaves everything else untouched. I run it as part of shipping now, and it costs a few seconds.
The producer itself is a small standalone tool, engram-build-timeline, pure standard library, installable with uv, that reads any git repository in place and never writes to it. Intermediate artifacts land in a cache under your home directory, not in the repository being analysed. The real output is the sync.
Somebody else’s repository
The generalisation test, concretely.
ENGRAM’s own repository is a flattering dataset and I knew it. Dense semver tags, one release per tag, conventional-commit scopes throughout, a documented ledger to check against. Clearing every gate there was necessary and nowhere near sufficient.
So I pointed the whole pipeline at block/buzz – a large Rust monorepo I had nothing to do with. Roughly 1,962 commits, 148 tags, around 25 workspace crates, squash-merged pull requests, no local merge commits at all. A blind ground truth was authored from its own architecture document before the clusterer was allowed anywhere near it.
The git arm generalised unchanged and fast. The tag-based deploy signal held: GitHub’s Deployments API was nearly empty there too, and the 98 semver tags carried the release story exactly as they do here. A third integration workflow turned up – every commit subject carries its pull-request number, so the full PR-to-commit spine is derivable from git alone without touching the API. Two bugs in the GitHub arm surfaced immediately, both of which had been latent and invisible in my own zero-PR repository.
And then the decomposition failed, informatively. It collapsed all ~25 Rust crates into a single crates bucket. Recall at the true grain: about 7%. The reason is embarrassing and useful – my rules knew that a package root looks like packages/<service>, because that is what a package root looks like here.
The split was already present in the extracted data. Only the clustering prior was wrong. And the fix is not “let the model figure it out”: the repository declares its own component grain in its workspace manifest. Read Cargo.toml‘s workspace members, or pnpm-workspace.yaml, or a root package.json‘s workspaces, or go.work, and each declared member is a component — deterministically, with no model and no per-repository hand-tuning. The model’s job shrinks to the genuine residue: components that cut across directories, sub-splits a manifest cannot express, and repositories with no workspace file at all.
The same lever turned out to reach dependency edges too, by swapping which manifest you read. ENGRAM’s inter-service topology is runtime HTTP, declared as service URLs in its compose file; buzz’s is a compile-time crate graph declared in Cargo manifests. Same parse, different manifest, 48 crate-to-crate edges, no model.
The best moment of that run was a side effect. Each derived edge carries a liveness count — is this declared dependency actually referenced anywhere in the source? Eight came back declared but never used. Five of them belonged to one crate, buzz-admin, whose manifest carries a comment reading “Mirrors buzz-relay’s setup.” Somebody had copied a dependency block wholesale from the hub crate. The tool found it on a repository nobody involved had ever seen, deterministically, on the first run.
That is the run that changed the design, which is why it gets the space here. It has not been the only one – the pipeline has since been pointed at other open-source repositories with different languages and different layouts, and those runs confirmed the approach holds rather than teaching it anything new. Which is what a generalisation test is supposed to do once the design is right.
Three axes, and one initiative
The Features view, concretely.
Components are an axis in space: where in the codebase. Milestones are an axis in release-time: which version. Neither of them is an initiative – a named body of work that spans a dozen components and a run of releases and is, to the person who did it, obviously one thing.
All the data for that was already captured and none of it was grouped. So the timeline gained a third axis: a feature arc that ties a run of releases, and through them their components and sessions, into one drillable object. The clustering is deterministic first (release names carry the initiative verbatim, and a name-pattern rule separates them cleanly) with a hand-authored override available where I know the real boundaries better than the tags do. Each arc carries a state of its own, derived the same way: still active, or shipped and closed out.
Which produces a result I did not anticipate enjoying as much as I did. The subject of the previous post in this series (the belief-revision work, the supersede-don’t-delete machinery, everything in What I Believed Last Tuesday) now appears in my own timeline as a single arc: Memory Fact Update, nine releases, fourteen components, fourteen sessions.
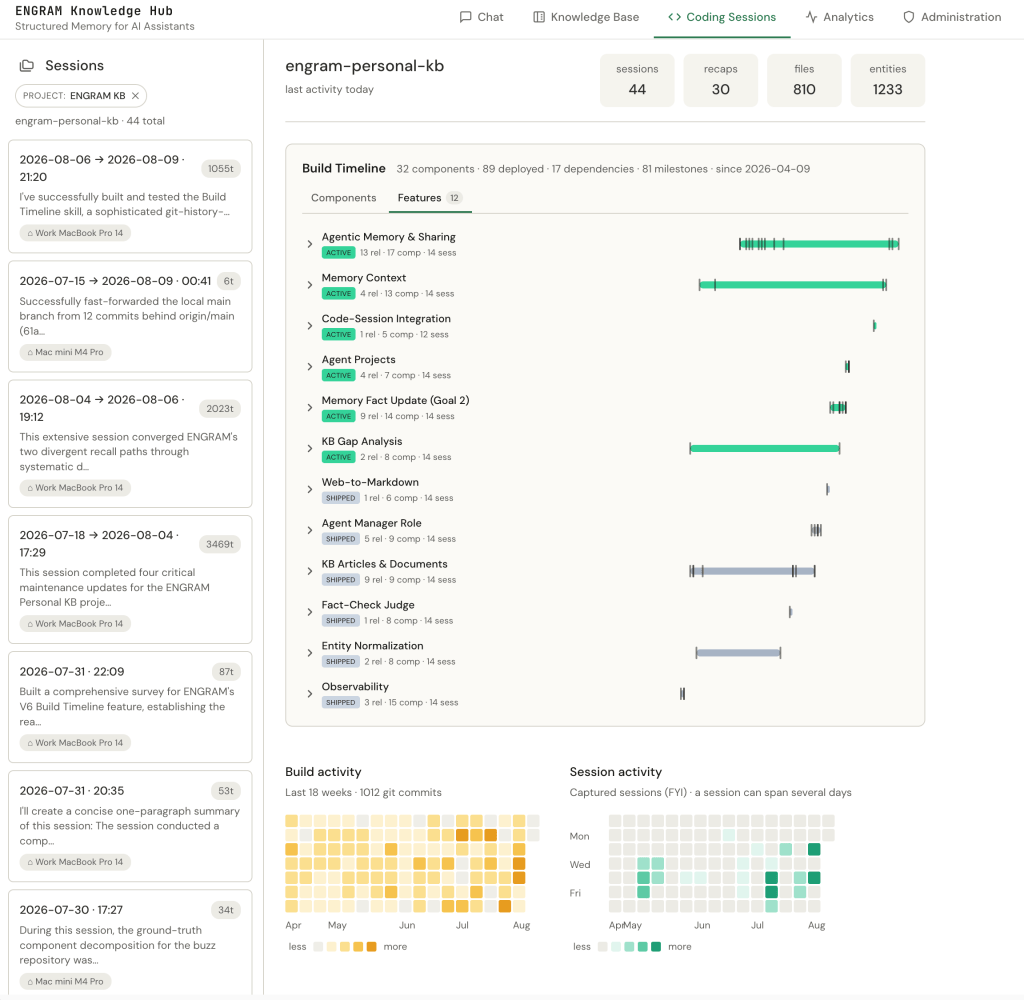
Nothing here was grouped by hand — the initiative boundaries were already sitting in the release names, waiting to be read.
Underneath sit the two activity heatmaps, and the honest comparison between them is the point: a dense wall of commits, and a much sparser scatter of captured sessions. The build history is complete because git kept it. The session history is only as complete as my capture habit, which is a thing I can now see rather than assume.
Expanding it gives you what it was made of.
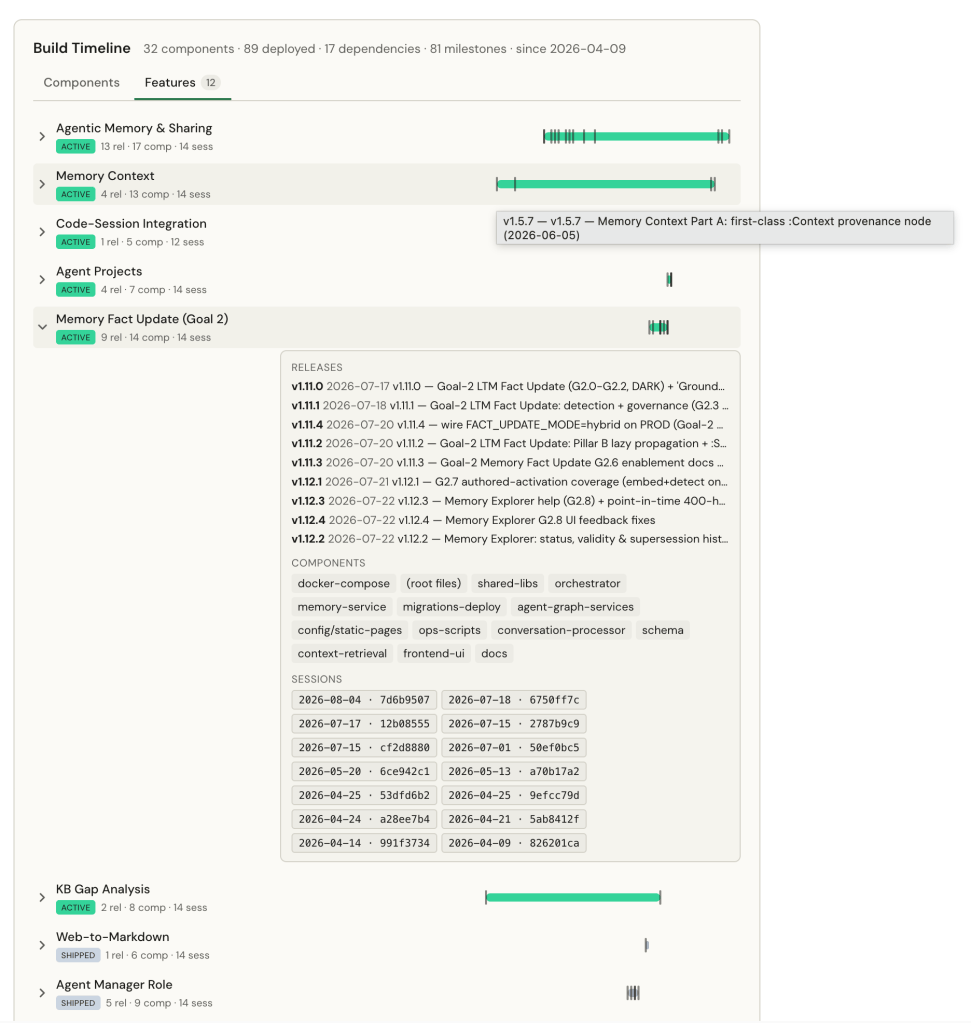
The same session pills as the Components view, reached from the other direction — by initiative rather than by place in the codebase.
Capturing at the source
The other half, concretely.
Those clickable session pills are the payoff of the whole design, and they work by matching the files a session edited against the paths a component owns. Which meant the timeline immediately exposed the weakness of how sessions were being captured in the first place.
The Watcher is passive (it reconstructs meaning after the fact from one tool’s on-disk transcripts) and that gives it three blind spots with a single cause. It only sees Claude Code CLI, so work in Claude Desktop or another agent leaves nothing to read. It cannot reach the pruned past, because Claude Code auto-prunes its transcripts and the meaning goes with the file. And its signal is thin: a quiet git commit -q prints no SHA to catch, and the auto-generated recap is frequently the harness’s “this session is being continued…” boilerplate rather than an account of what got built.
So capture moved inside the session. A single MCP call ( capture_session ) gathers ground truth from where the work is actually happening: the exact HEAD SHA, the files touched, and a summary the agent authors deliberately. Only the session id and the summary are required; each of the others adds signal, and the touched files are what turn a session into precise component evidence.
Crucially it is additive rather than a replacement. Capture and the Watcher key on the same session id and converge on the same node in the graph: the capture supplies the exact SHA and a summary worth reading, the Watcher (where it ran at all) supplies the exhaustive action list. One session, not two. And because it is an MCP call rather than a file format, it works from any agent that can reach ENGRAM – which are exactly the surfaces the Watcher is blind to.
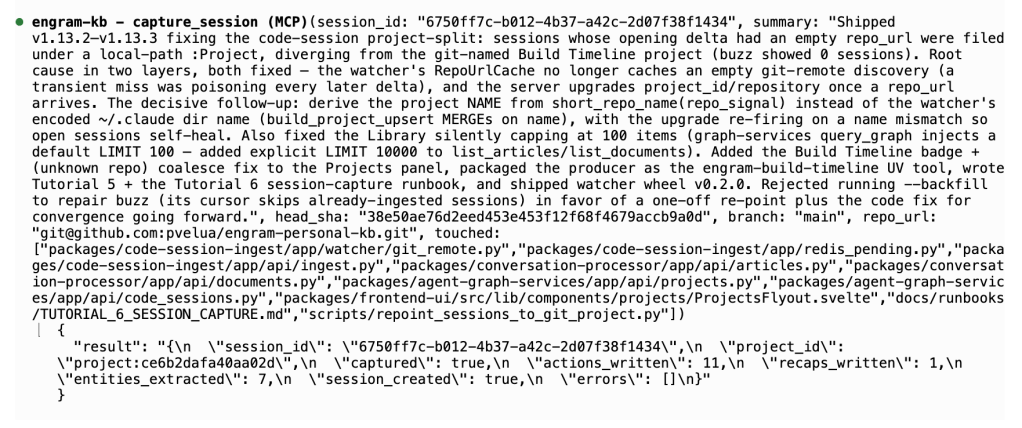
capture_session call and its response — the session written from inside the work, with no transcript required. The summary is authored rather than reconstructed, which is the difference between a record of what happened and a record of what it meant.For Claude Code there is a slash command that wraps the same call and does the gathering for you, but the MCP tool is the recommended path, and it needs nothing installed beyond the connection to ENGRAM server you already have.
Honest limitations
What this does not do, concretely.
The coverage number bounds the truth from above, and I had been reading it as though it stated the truth. All 81 releases shipped inside the capture window, which runs from 9 April to 11 August. A hundred per cent – of exactly one thing: how much of the release history happened while session capture was running. The metric does not check whether a session actually touched any given release, so it is a ceiling on how much of this build has narrative attached rather than a measurement of it. My own design notes described it as state changes with session context behind them, which is a stronger claim than the code makes, and I had been reading my own number that way for weeks.
The proof is in how it moved. It went from 83% to 100% in a fortnight, and attribution did not improve at all in that time – the capture window simply caught up with the release history behind it. Which is precisely what the measure exists to report, and a genuinely useful thing to know. It is just not the question I thought I was asking. The measure I actually want, how many releases have a session properly attached to them, is one I still have to build. There is a component-level figure too, which I am not going to quote: components here are long-lived enough that nearly all of them get touched eventually, so it flatters without informing.
The past is not recoverable, and I learned that the hard way. I shipped a change to extract commit SHAs from session transcripts, ran the backfill across DEV machines, and enriched almost nothing – because the transcripts had already been auto-pruned by Claude Code. You cannot backfill meaning into a past whose source has been deleted. That is the entire argument for capturing sessions at the source, and I would rather have reached it by reasoning than by running the backfill.
A recap is only as good as whoever wrote it. The auto-generated recaps were largely continuation boilerplate, which made “click a bar, see what we were thinking” much weaker than the design promised. Authored summaries fix this going forward; nothing fixes it backwards.
Absence means no signal, not no work. A missing lifecycle band means git shows nothing, not that a step was skipped. Front-end surfaces show no tested band because their tests are not co-located per surface — technically correct and genuinely misleading, which is why the legend says so on the screen rather than in a footnote.
Dependency edges cover two ecosystems. Docker Compose topologies and Cargo workspaces derive a real graph today. Other stacks would get components, milestones and activity with an empty dependency graph – left empty on purpose, rather than guessed. Cross-language runtime edges are the residue both test runs left: ENGRAM’s front-end reaching its orchestrator through a same-origin proxy, buzz’s desktop and mobile clients reaching the relay over WebSockets. Neither is declared in any manifest, so neither is derived.
And one caveat on the 100%. The accurate summary of the decomposition finding is not “this layer is deterministic.” It is: when a repository has a legible convention, deterministic rules beat the model, and the model’s job is to discover the convention when there is not one. buzz is the reason that sentence is phrased carefully.
What it adds up to
The transcript records what was tried. Git records what shipped. The timeline is where they finally meet. Now that it exists, the thing I look at first is not the timeline itself but the single amber flag still sitting at the top of it, telling me about a component I stopped seeing back in April.
The Build Timeline and session capture are both live on PROD. There are two hands-on walkthroughs if you want to run it against your own repository (one for generating a timeline from any git repository, one for capturing a session from inside it) and a documentation chapter that goes deeper on every panel.
ENGRAM is in private beta, by invitation.
For the background this builds on:
- Claude Code and ENGRAM Knowledge Hub: recalling the good memories together – the session-ingestion foundation this post revises and extends.
- What I Believed Last Tuesday: ENGRAM Learns to Change Its Mind – the supersede-don’t-delete model that component states reuse wholesale.
- The Layer a Harness Can’t Own – why the capture path had to be harness-neutral rather than Claude Code-shaped.
- Tutorial: See how your project was built – install the UV tool and generate a timeline from any repository.
- Tutorial: Capture a coding session from inside it – using the MCP call and the slash command, step by step guide.
- Coding & Build Timeline – the documentation chapter covering every panel in detail.


1 Comment